This page shows the NSS 2015 College results and Sector results for the Department of Computing.
Tabbed information block
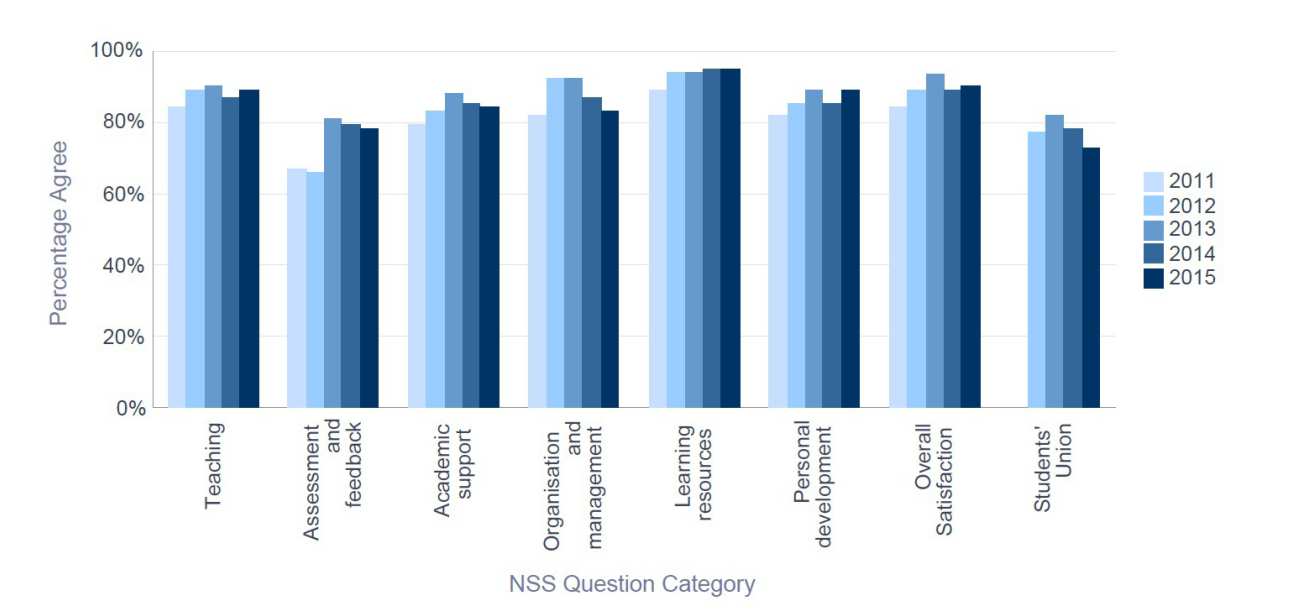 This graph shows shows the trend in the Department of Computing's NSS 2015 Percentage Agree results for the years 2011-2015, in each of the NSS Question Categories. The Students' Union was a new Question Category for 2012.
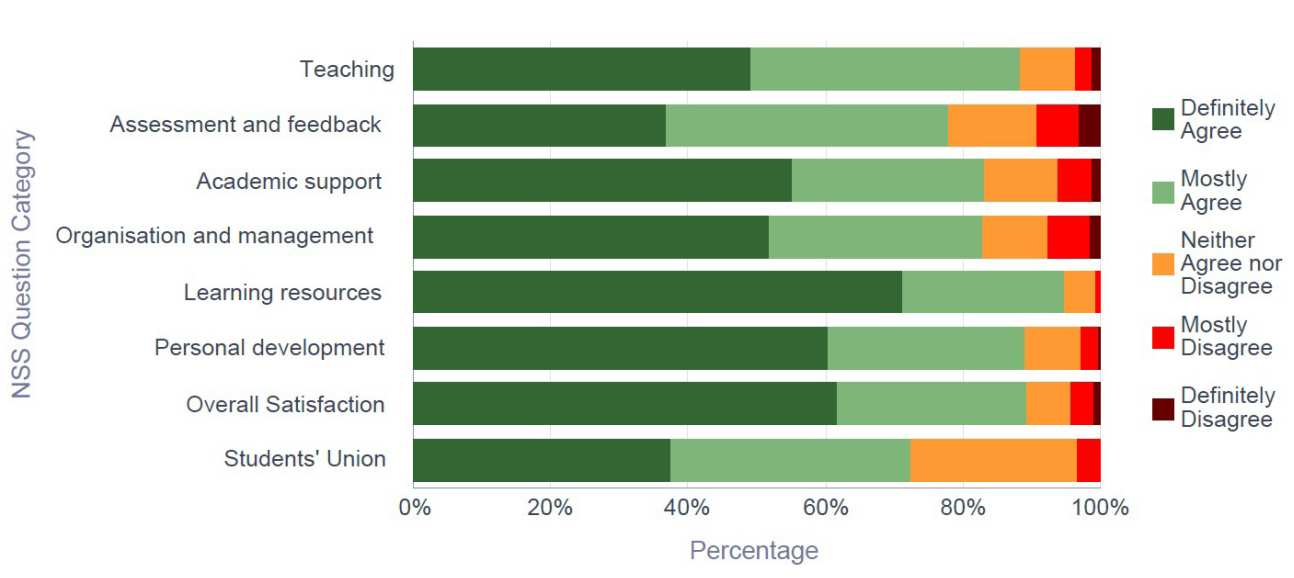 This graph shows the Department's NSS 2015 results for each NSS question category, broken down by the five possible responses to questions (Definitely Agree, Mostly Agree, Neither Agree nor Disagree, Mostly Disagree, Definitely Disagree). The Percentage Agree score is the proportion of respondents answering Definitely or Mostly Agree to a question.
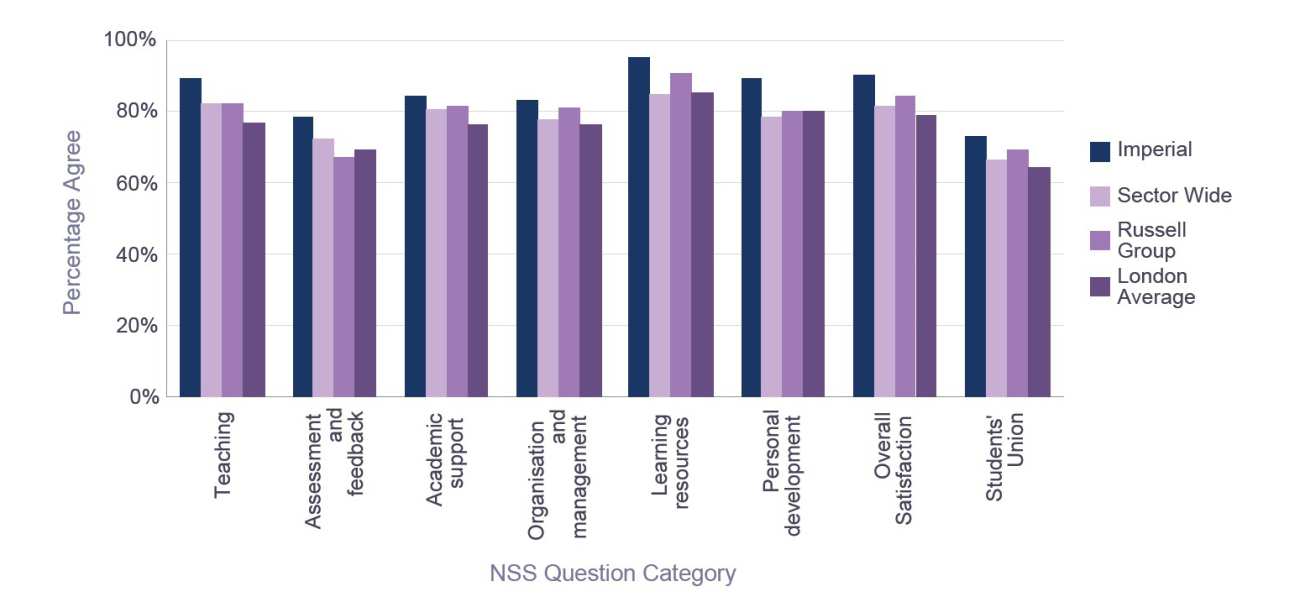
This graph shows the NSS 2015 results for the Department of Computing and key group averages, by NSS question category. The Department was ranked 17th out of 105 Higher Education Institutions in the sector for Overall Satisfaction.