This page shows the NSS 2017 College results and Sector results for the Department of Life Sciences split into two subject streams, Biochemistry and Biology.
Tabbed information block
Biochemistry
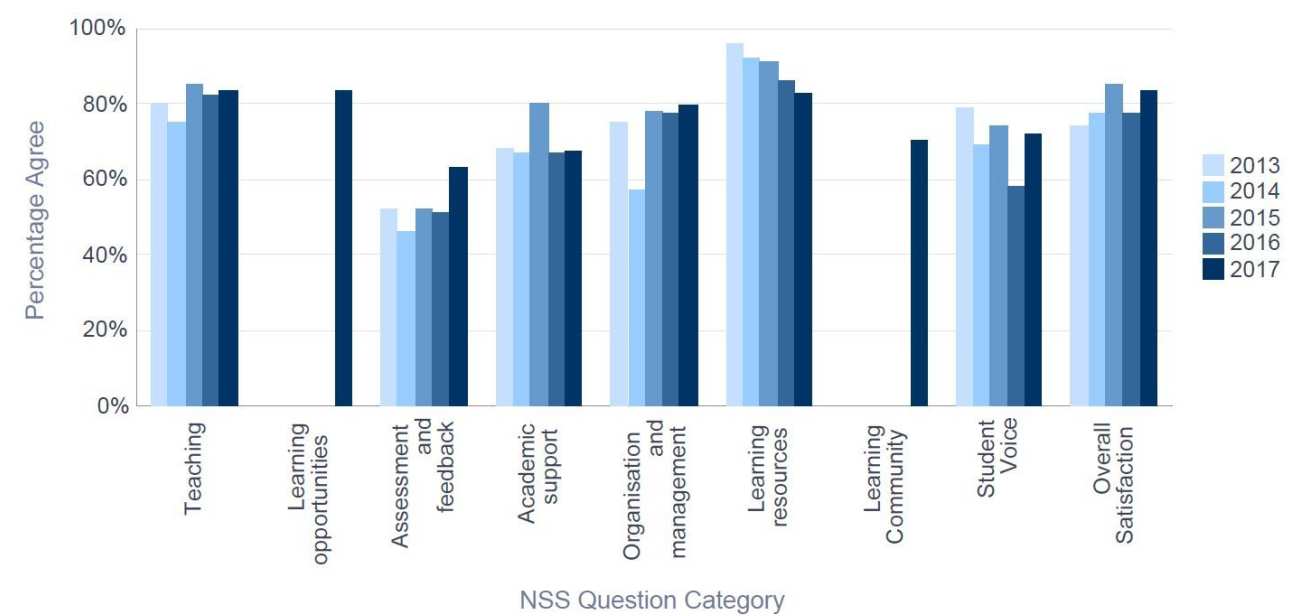 This graph shows shows the trend in the College's Biochemistry NSS 2017 Percentage Agree results for the years 2013-2017, in each of the NSS Question Categories.
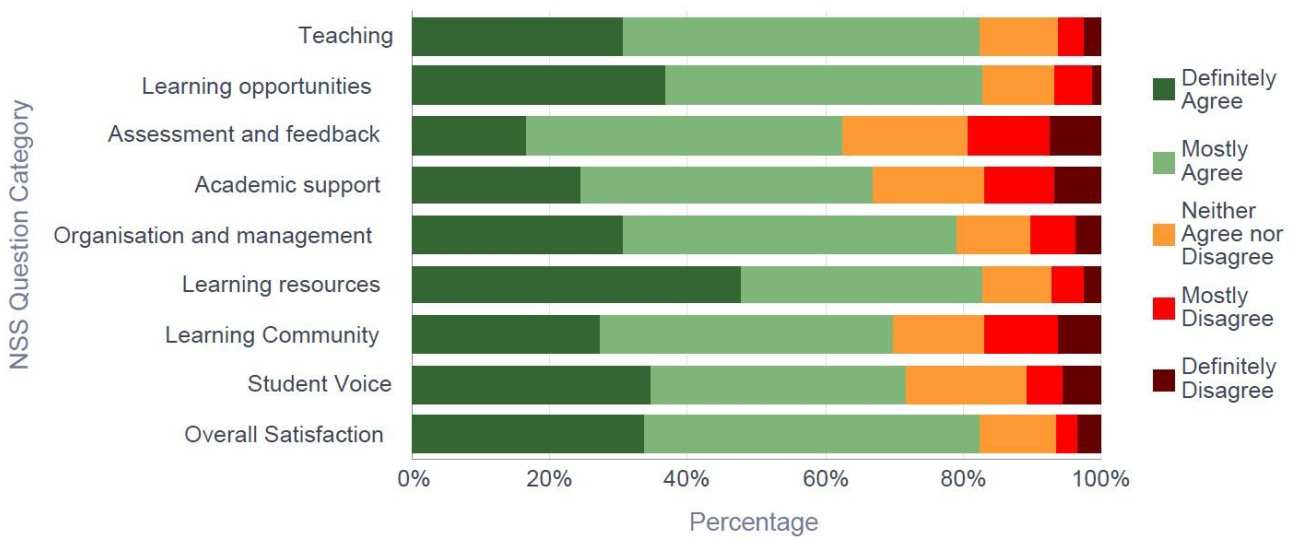
This graph shows the Department's NSS 2017 results for each NSS question category, broken down by the five possible responses to questions (Definitely Agree, Mostly Agree, Neither Agree nor Disagree, Mostly Disagree, Definitely Disagree). The Percentage Agree score is the proportion of respondents answering Definitely or Mostly Agree to a question.
Biological Sciences
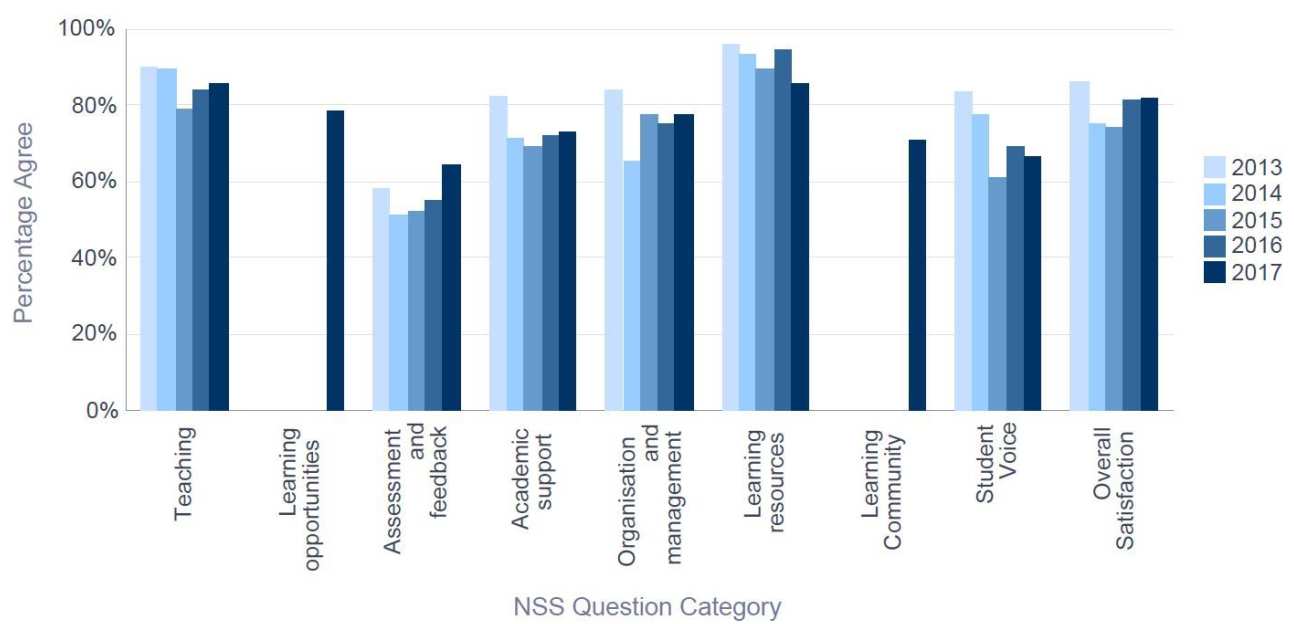
This graph shows shows the trend in the College's Biological Sciences NSS 2017 Percentage Agree results for the years 2013-2017, in each of the NSS Question Categories.
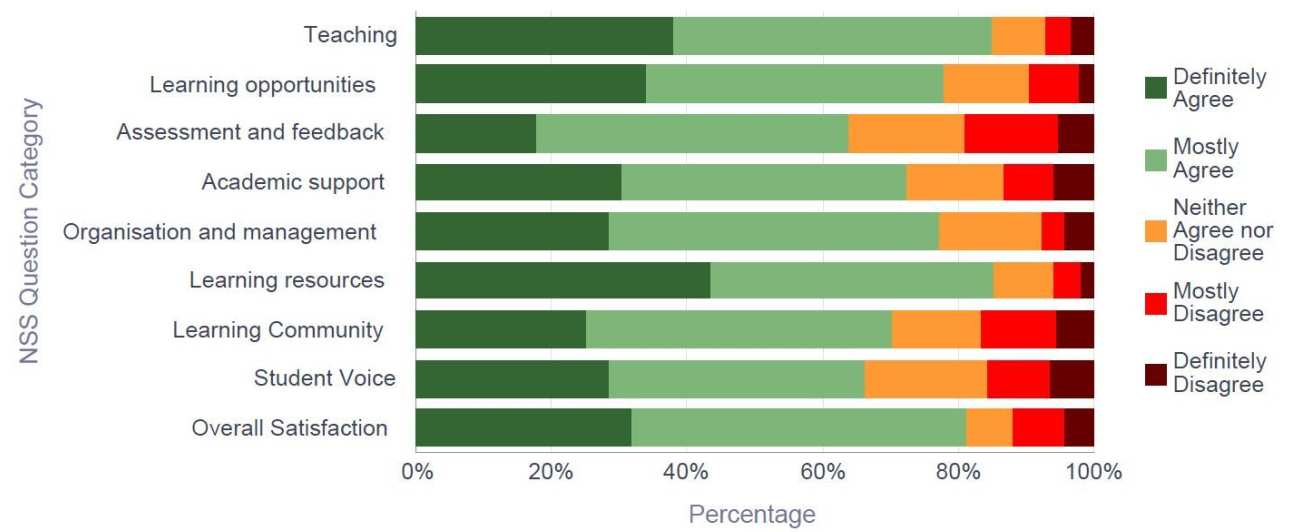
This graph shows the Department's NSS 2017 results for each NSS question category, broken down by the five possible responses to questions (Definitely Agree, Mostly Agree, Neither Agree nor Disagree, Mostly Disagree, Definitely Disagree). The Percentage Agree score is the proportion of respondents answering Definitely or Mostly Agree to a question.
NSS Subject: Molecular Biology, Biophysics and Biochemistry
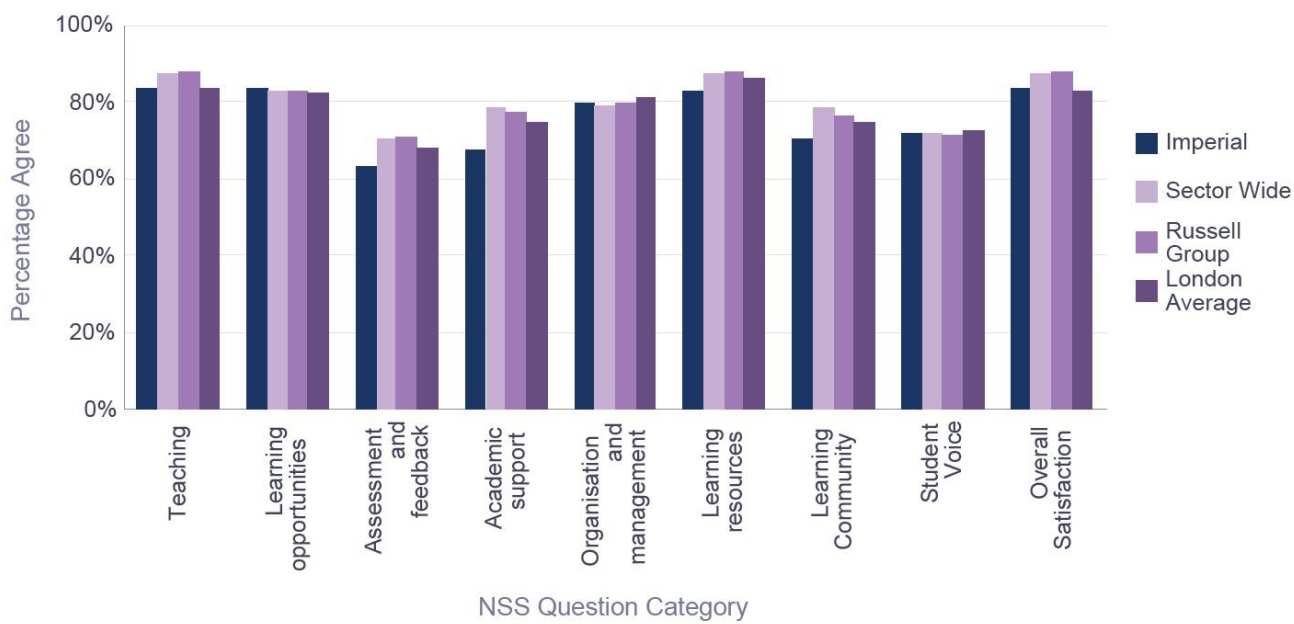 This graph shows the NSS 2017 results for the College and key group averages, by NSS question category in the NSS Subject Molecular Biology, Biophysics and Biochemistry.
NSS Subject: Biology
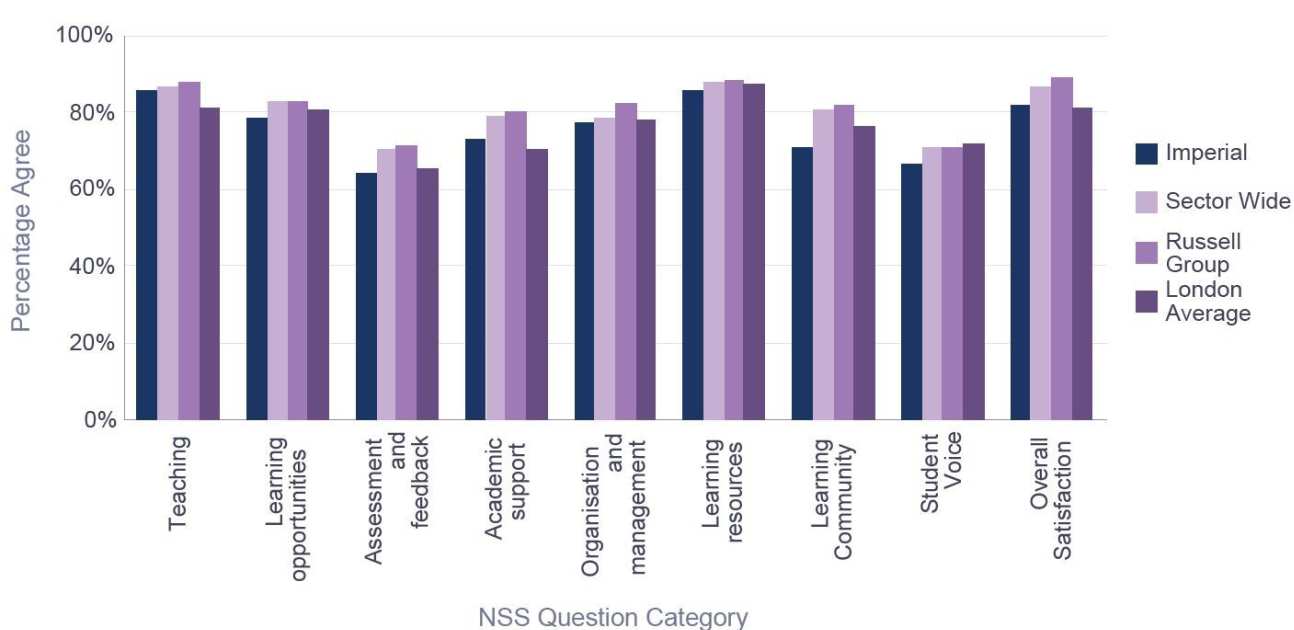
This graph shows the NSS 2017 results for the College and key group averages, by NSS question category in the NSS Subject Biology.