Risks from tropical cyclones emerge through the interplay of the hazard (the cyclone itself), the exposure of goods and people, the local levels of vulnerability and the preparedness of societies in the face of the event.
To calculate the direct damage from a tropical cyclone at a specific location, damage functions (also known as impact functions) are used, to relate the hazard intensity to relative impact on the ground.
Here, we use a damage function previously published in peer-reviewed literature by Emanuel (2011) and Eberenz et al. (2021), which defines the damage function f as a function of wind speed V.
Generally, no wind-induced damage is foreseen for low wind speed but beyond a certain threshold Vthresh, an increase in damage with wind speed is expected (Figure 1). This wind-speed-dependent damage function also implicitly accounts for the damage caused by storm surges and torrential rain when calibrated against reported total damage data.
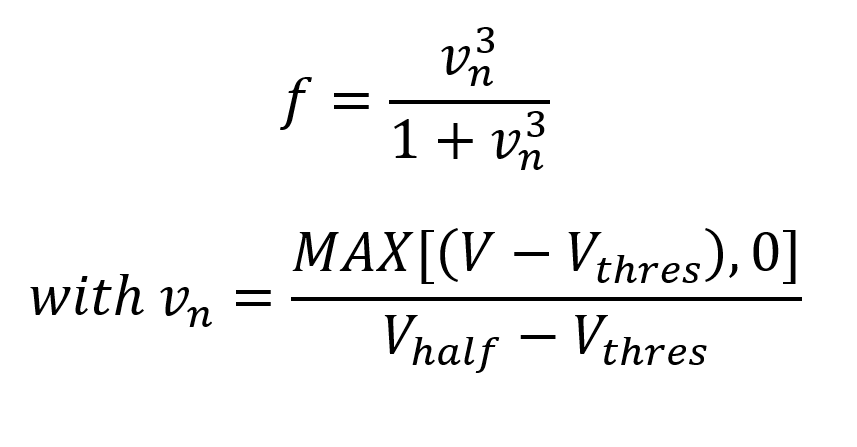
The function takes two shape parameters as inputs:
- Vthresh is the wind speed at which no direct wind-induced damage is expected, often assumed to be 25.7 m/s.
- Vhalf is wind speed at which the function’s slope is the steepest and a damage ratio of 50 % is reached. This depends on building type and surface roughness.
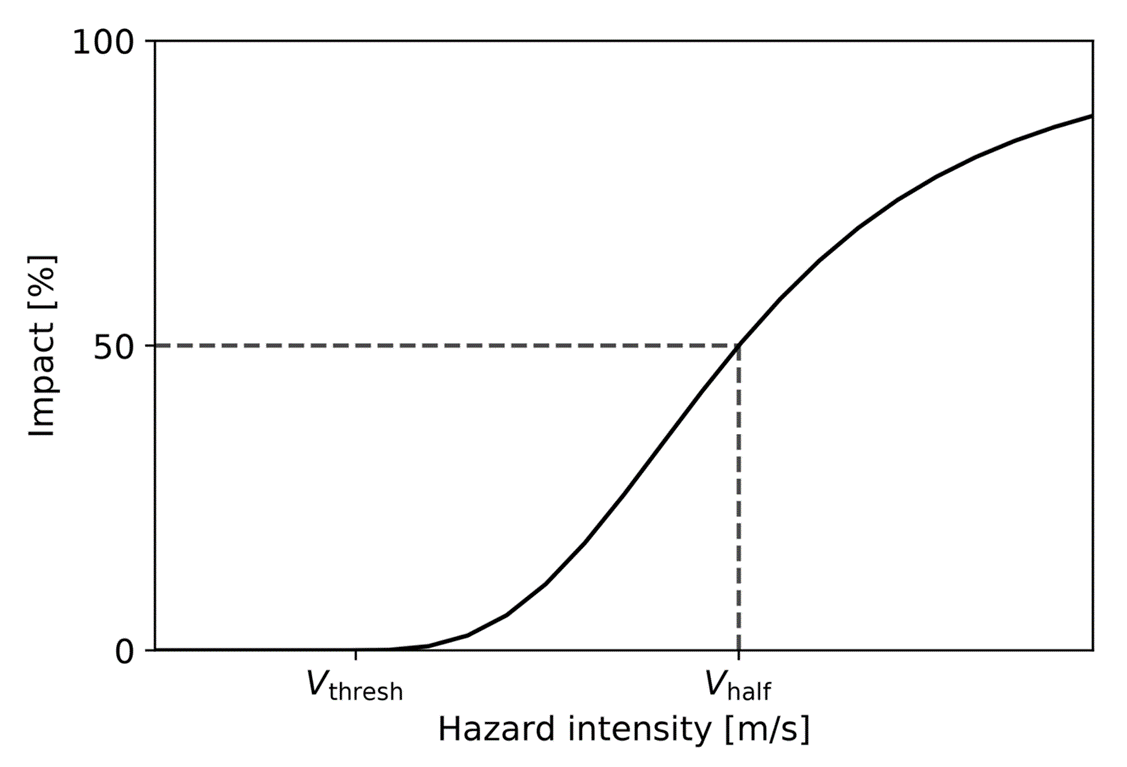
Figure 1: Idealized sigmoidal TC damage function from on Emanuel (2011) and Eberenz et al. (2021)
Regional vulnerability calibration
The National Oceanic and Atmospheric Administration (NOAA) point to the extreme sensitivity of damage to what appear as modest changes in wind speed. There is a fourfold increase in damage for every increase in Hurricane Category.
To better account for regional vulnerabilities, Vhalf is calibrated based on geography, data availability and patterns in damage ratios before calibration. Eberenz et al. (2021) have calculated Vhalf values for nine regions, summarised in Table 1 below. The global default uncalibrated Vhalf is equal to 74.7 m/s. Typically, the calibration is done so that the annual average loss with our wind model, IRIS, agrees with that reported in the country.
Table 1: Damage function slope parameter Vhalf per region, from Eberenz et al. (2021). Countries marked with an asterisk (*) are considered for calibration (53 in total).
| Regions | Countries | Vhalf (m/s) |
|---|---|---|
| North Atlantic 1 (NA1) | Anguilla; Antigua and Barbuda∗ ; Argentina; Aruba; Bahamas∗ ; Barba- dos; Belize∗; Bermuda∗; Plurinational State of Bolivia; Cabo Verde∗; Cayman Islands; Chile; Colombia; Costa Rica; Cuba∗ ; Dominica∗ ; Dominican Republic∗; Ecuador; El Salvador; Falkland Islands (Malvinas); French Guiana; Grenada; Guadeloupe; Guatemala; Guyana; Haiti; Honduras∗ ; Jamaica∗ ; Martinique; Mexico∗ ; Montserrat∗ ; Nicaragua∗ ; Panama; Paraguay; Peru; Puerto Rico∗; Saint Helena, Ascension and Tris- tan da Cunha; Saint Kitts and Nevis∗; Saint Lucia∗; Saint Vincent and the Grenadines∗; Sint Maarten (Dutch part); Suriname; Trinidad and Tobago∗; Turks and Caicos Islands∗; Uruguay; Bolivarian Republic of Venezuela; British Virgin Islands∗; US Virgin Islands* | 59.6 |
| North Atlantic 2 (NA2) | Canada*; United States of America* | 74.7 |
| North Indian (NI) | Afghanistan; Armenia; Azerbaijan; Bahrain; Bangladesh∗; Bhutan; Djibouti; Eritrea; Ethiopia; Georgia; India*; Islamic Republic of Iran; Iraq; Israel; Jordan; Kazakhstan; Kuwait; Kyrgyzstan; Lebanon; Maldives; Mongolia; Myanmar*; Nepal; Oman*; Pakistan; Qatar; Saudi Arabia; Somalia; Sri Lanka*; Syrian Arab Republic; Tajikistan; Turkmenistan; Uganda; United Arab Emirates; Uzbekistan; Yemen* | 58.7 |
| Oceania (OC) | American Samoa; Australia*; Cook Islands; Fiji*; French Polynesia*; Guam*; Kiribati; Marshall Islands; Federated States of Micronesia*; Nauru; New Caledonia*; New Zealand; Niue; Norfolk Island; northern Mariana Is- lands; Palau; Papua New Guinea*; Pitcairn; Samoa*; Solomon Islands*; Timor-Leste; Tokelau; Tonga*; Tuvalu; Vanuatu*; Wallis and Futuna | 49.7 |
| South Indian (SI) | Comoros; Democratic Republic of the Congo; Eswatini; Madagascar*; Malawi; Mali; Mauritius; Mozambique*; South Africa; United Republic of Tanzania; Zimbabwe | 46.8 |
| North West Pacific 1 (WP1) | Cambodia*; Indonesia; Lao People’s Democratic Republic; Malaysia*; Thailand*; Viet Nam* | 56.7 |
| North West Pacific 2 (WP2) | Philippines* | 84.7 |
| North West Pacific 3 (WP3) | Mainland China* | 80.2 |
| North West Pacific 4 (WP4) | Hong Kong*; Japan*; Republic of Korea*; Macao*; Taiwan* | 135.6 |
| Global calibration | 73.4 |
Asset exposure data
We use the asset exposure data from Eberenz et al. (2020), a globally consistent method that disaggregates asset value data based on a combination of nightlight intensity and geographical population data (Figure 2).
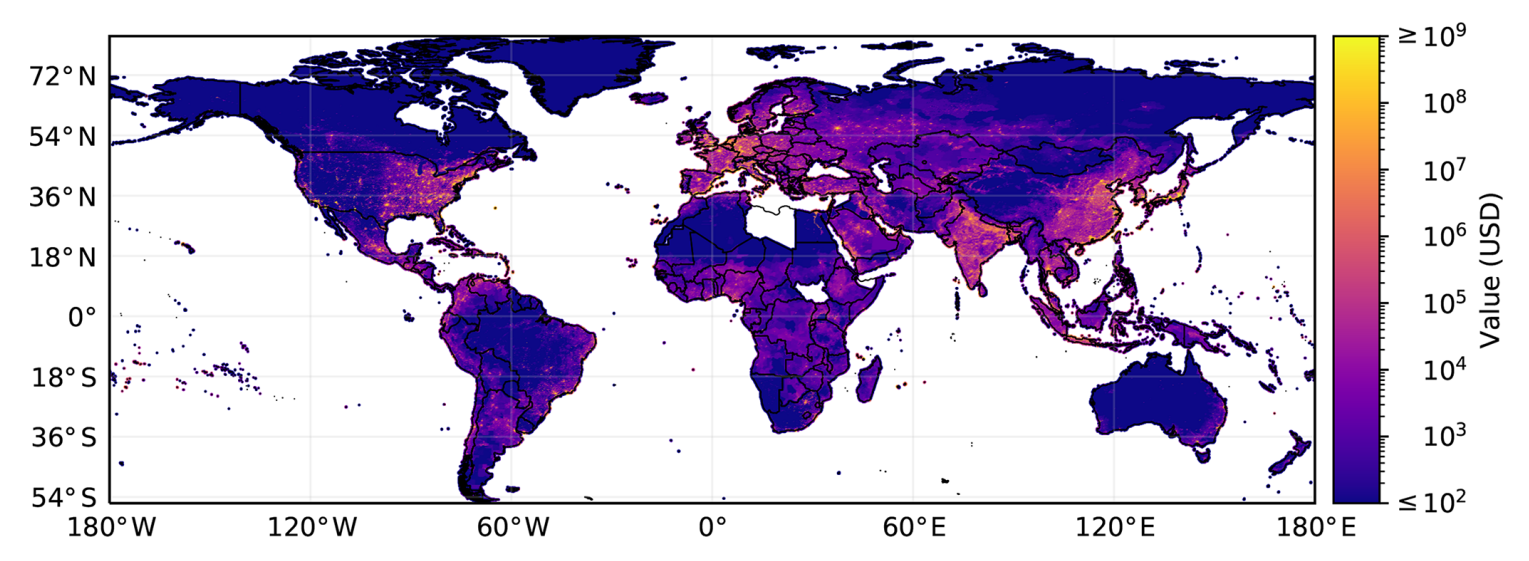
Figure 2: World map of gridded asset exposure values from Eberenz et al. (2020)
Calculation of economic losses from climate change
The damage function and asset exposure data presented above are used to calculate the event’s estimated losses in current and pre-industrial climates, using the Imperial Storm Model IRIS.
As shown in Figure 3, this allows to estimate change in intensity of the tropical cyclone in current and pre-industrial climates, which translates into different amounts of economic losses.
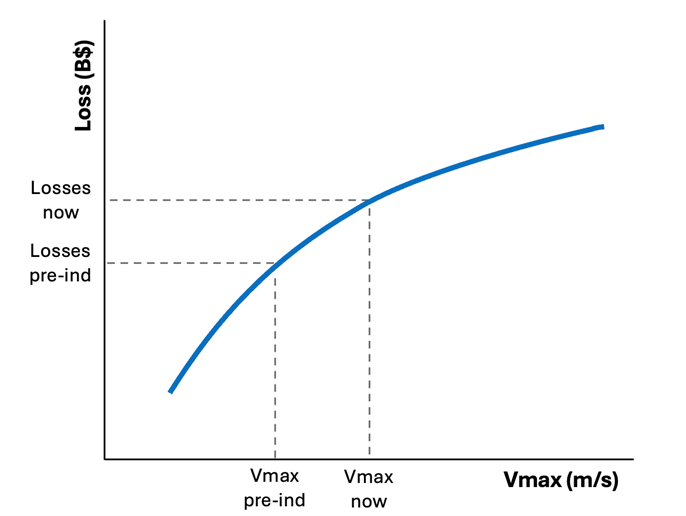
Figure 3: Economic losses (B$) vs landfall windspeed/maximum velocity (Vmax) (m/s) of a hypothetical tropical cyclone
Fraction of Attributable Losses
To present our results as a percentage, we define the Fraction of Attributable Losses (FAL), a novel variable to quantify the portion of losses of an extreme event associated with climate change:
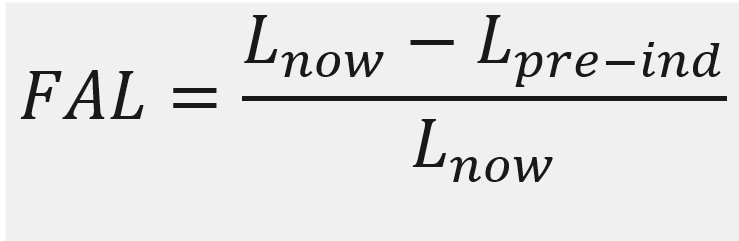
With:
- Lnow: economic losses for the current climate
- Lpre-ind: economic losses for the pre-industrial climate