Published October 2024.
Summary
The IRIS model estimates that the intensity of "Helene" type Category 4 hurricanes at landfall was about twice more likely in the 2024 climate compared to a pre-industrial time baseline. We also estimate that nearly half (44%) of the loss in Florida of a "Helene" type Category 4 can be attributed to climate change.
Background
Hurricane Helene was a large Category 4 hurricane at landfall on the 26 September 2024 that caused significant damage across Florida and the southeastern United States. It was the eighth named storm, fifth hurricane, and second major hurricane of the 2024 Atlantic hurricane season. At least 200 people died in storm-related incidents, making it the deadliest hurricane since Katrina. There are a wide range of estimated total economic losses. They could be more than $100bn, most of that beyond Florida involving flooding. Here we examine only the Florida wind damages.
Maximum wind at landfall
The IRIS model (Sparks and Toumi, 2024) can be used to infer the additional strengthening of a “Helene” type storm that can be attributed to recent warming or more specifically to recent changes in potential intensity. We first need to consider the change in the thermodynamic environment. There has been a recent global warming of about 0.2°C/decade putting the 2024 global mean temperature close to about 1.3°C above pre-industrial temperature. ERA5 reanalysis is used to calculate monthly mean PI fields between 1980 and 2023. We consider global warming to manifest itself differently with latitude. We have low confidence in attributing regional or longitude trends to global or anthropogenic warming.
The regional changes are more likely to be caused by decadal variations and less likely to be sustained or representative of global warming. It is for example very unlikely that the Gulf of Mexico will continue to warm relative to the globe at the current rate. We are assuming that the underlying anthropogenic trend in PI is best represented by the zonal mean. We know of no evidence, e.g. from climate models, that the anthropogenic portion of the increase in the PI in the Gulf of Mexico is enhanced compared to the zonal mean. If it is, then our attribution estimate would be conservative.
To calculate the PI field in any given year we apply the corresponding monthly (September) global zonal mean trend to the 1980-2023 monthly mean PI field. In this way we can estimate the regressed anomalous PI field in any month since industrialisation and scale this by the simultaneous global mean surface temperature. This regressed value is not the actual PI now but that portion due to a linear change since 1980.
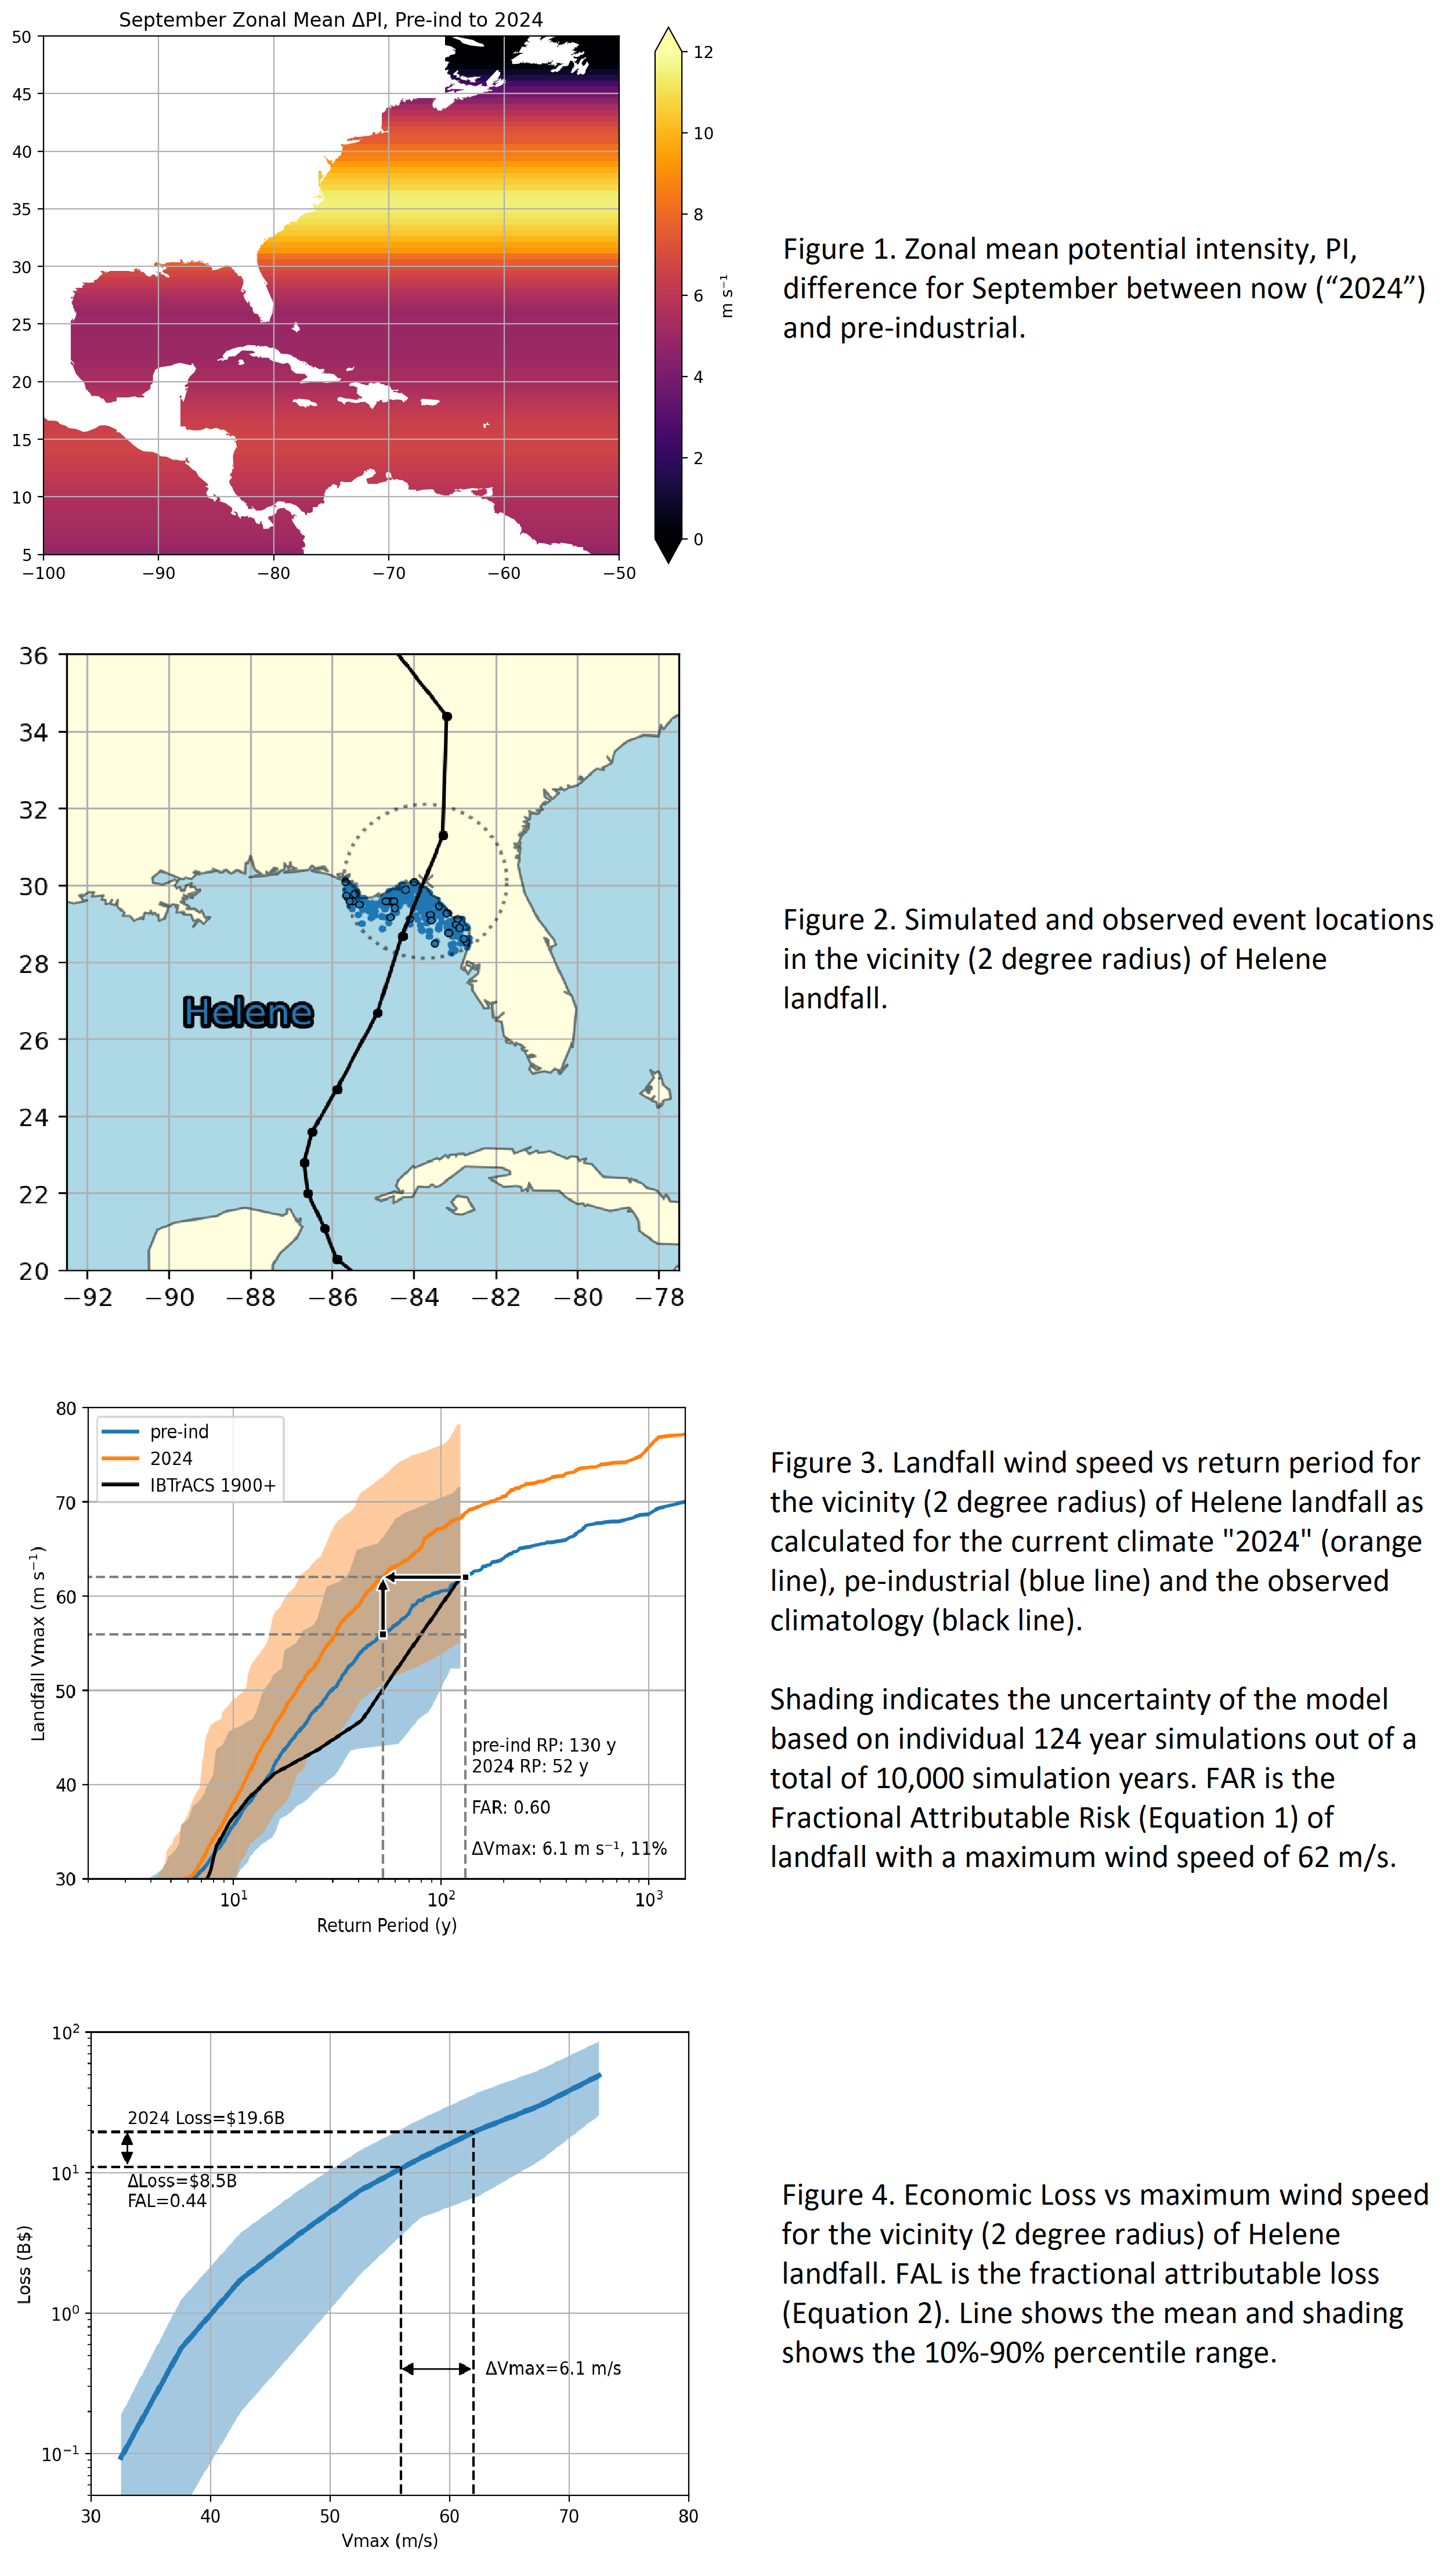
The pre-industrial state is equivalent to the global mean surface temperature of the 1950s. The pre-industrial value of PI is determined by regressing ERA5 backwards in time. Figure 1 shows the zonal mean difference in September PI between 2024 and the pre-industrial estimate. There are large trends in the tropics which decline towards the subtropics and then increase again at larger latitudes. This meridional structure is interesting and is different to the SST trends which tend to gradually increase from the tropics to higher latitude. The difference in pattern between PI and SST is caused by the important role of moisture trends. The PI difference between 2024 and pre-industrial is about +6 m/s in the Gulf of Mexico.
The frequency of landfall is the next consideration. The IRIS model does not change the number of events in the Atlantic, only the initial life-time maximum intensity is modified by the PI. Figure 2 shows the events of the 10,000-year simulation of hurricanes entering the Big Bend region (within 2 degrees of the actual landfall location).
The historic tracks passing through that region are very rare. However, the figure shows that the model does simulate many tracks passing through the region. Many had their life-time maximum intensity to the southwest in the Central Gulf. The tracks in IRIS are generated as deviations of the observed/historical “parent tracks”. Few of these parent tracks entered or made landfall in the region but the track algorithm allows spatial deviation from the parent track at a rate of the track “error” growth in numerical weather prediction. This method does convert many historic “near misses” to then enter the region of interest.
Figure 3 shows the return period plot for hurricane wind speeds in the region near Helene’s landfall (2 degree radius) as observed and modelled. Landfall observations in the region are sparse over the 124 years used to build the IRIS model. However, the 2 degree radius region gives a reasonable sample for validation. In the case of Helene, a category 4 at landfall, we estimate that this type of event was about twice as likely compared to pre-industrial times.
The return period has decreased from 130 yr to 53 yr. For the same return period the current wind speed compared to pre-industrial events has increased by 6.1 m/s or 11%. In the climate change attribution literature the fractional attributable risk, FAR, is frequently used.
FAR is here defined as
FAR= (Pnow -PPre-Ind )/Pnow (1)
where Pnow and PPre-Ind are the probabilities of an event of the minimum intensity for the current (now) and pre-industrial (Pre-Ind) climate respectively. The FAR for “Helene” type is 0.60. This means that 60% of the likelihood of a Helen type event can be attributed to climate change.
Economic loss
For the first time we have used IRIS to make an estimate of economic loss. We have combined IRIS wind fields with the Climada data which has a single damage function (Eberenz et al. 2021) and 10km gridded exposure (Eberenz et al. 2020). For the damage function we apply a minimum wind threshold for damage of 25.7 m/s and a half-damage wind speed of 74.7 m/s for the single damage function.
Figure 4 shows the economic losses estimated. To communicate the effect of climate change on loss we propose a new variable: the fractional attributable loss, FAL. It is defined as
FAL= ( Lnow-LPre-Ind)/Lnow (2)
where L is the economic loss for the current (now) and pre-industrial climate (Pre-Ind). We estimate the FAL for "Helene" is 0.44. This means 44% or nearly half the economic damage can be attributed to climate change. This only refers to the Florida (Big Bend) damage, not the additional damage caused as the track moved further inland. Unlike the absolute loss amount, the FAL is not very sensitive to the details of the exposure and damage function (wind speed of half damage).
This analysis is relevant to the Florida loss. This is not the same as the actual total loss due to Helene, because this analysis does not include the extensive loss of life and flood damages caused further inland in the South East.
Eberenz, S., Lüthi, S., and Bresch, D. N.: Regional tropical cyclone impact functions for globally consistent risk assessments, Nat. Hazards Earth Syst. Sci., 21, 393–415, https://doi.org/10.5194/nhess-21-393-2021, 2021.
Eberenz, S., Stocker, D., Röösli, T., and Bresch, D. N.: Asset exposure data for global physical risk assessment, Earth Syst. Sci. Data, 12, 817–833, https://doi.org/10.5194/essd-12-817-2020, 2020.
Sparks, N., Toumi, R. The Imperial College Storm Model (IRIS) Dataset. Sci Data 11, 424 (2024). https://doi.org/10.1038/s41597-024-03250-y