Typhoon Shanshan made 7.5% more intense and 26% more likely by climate change
Typhoon Shanshan made landfall in southwestern Japan on 29th August 2024, lashing the country with torrential rain and strong winds.
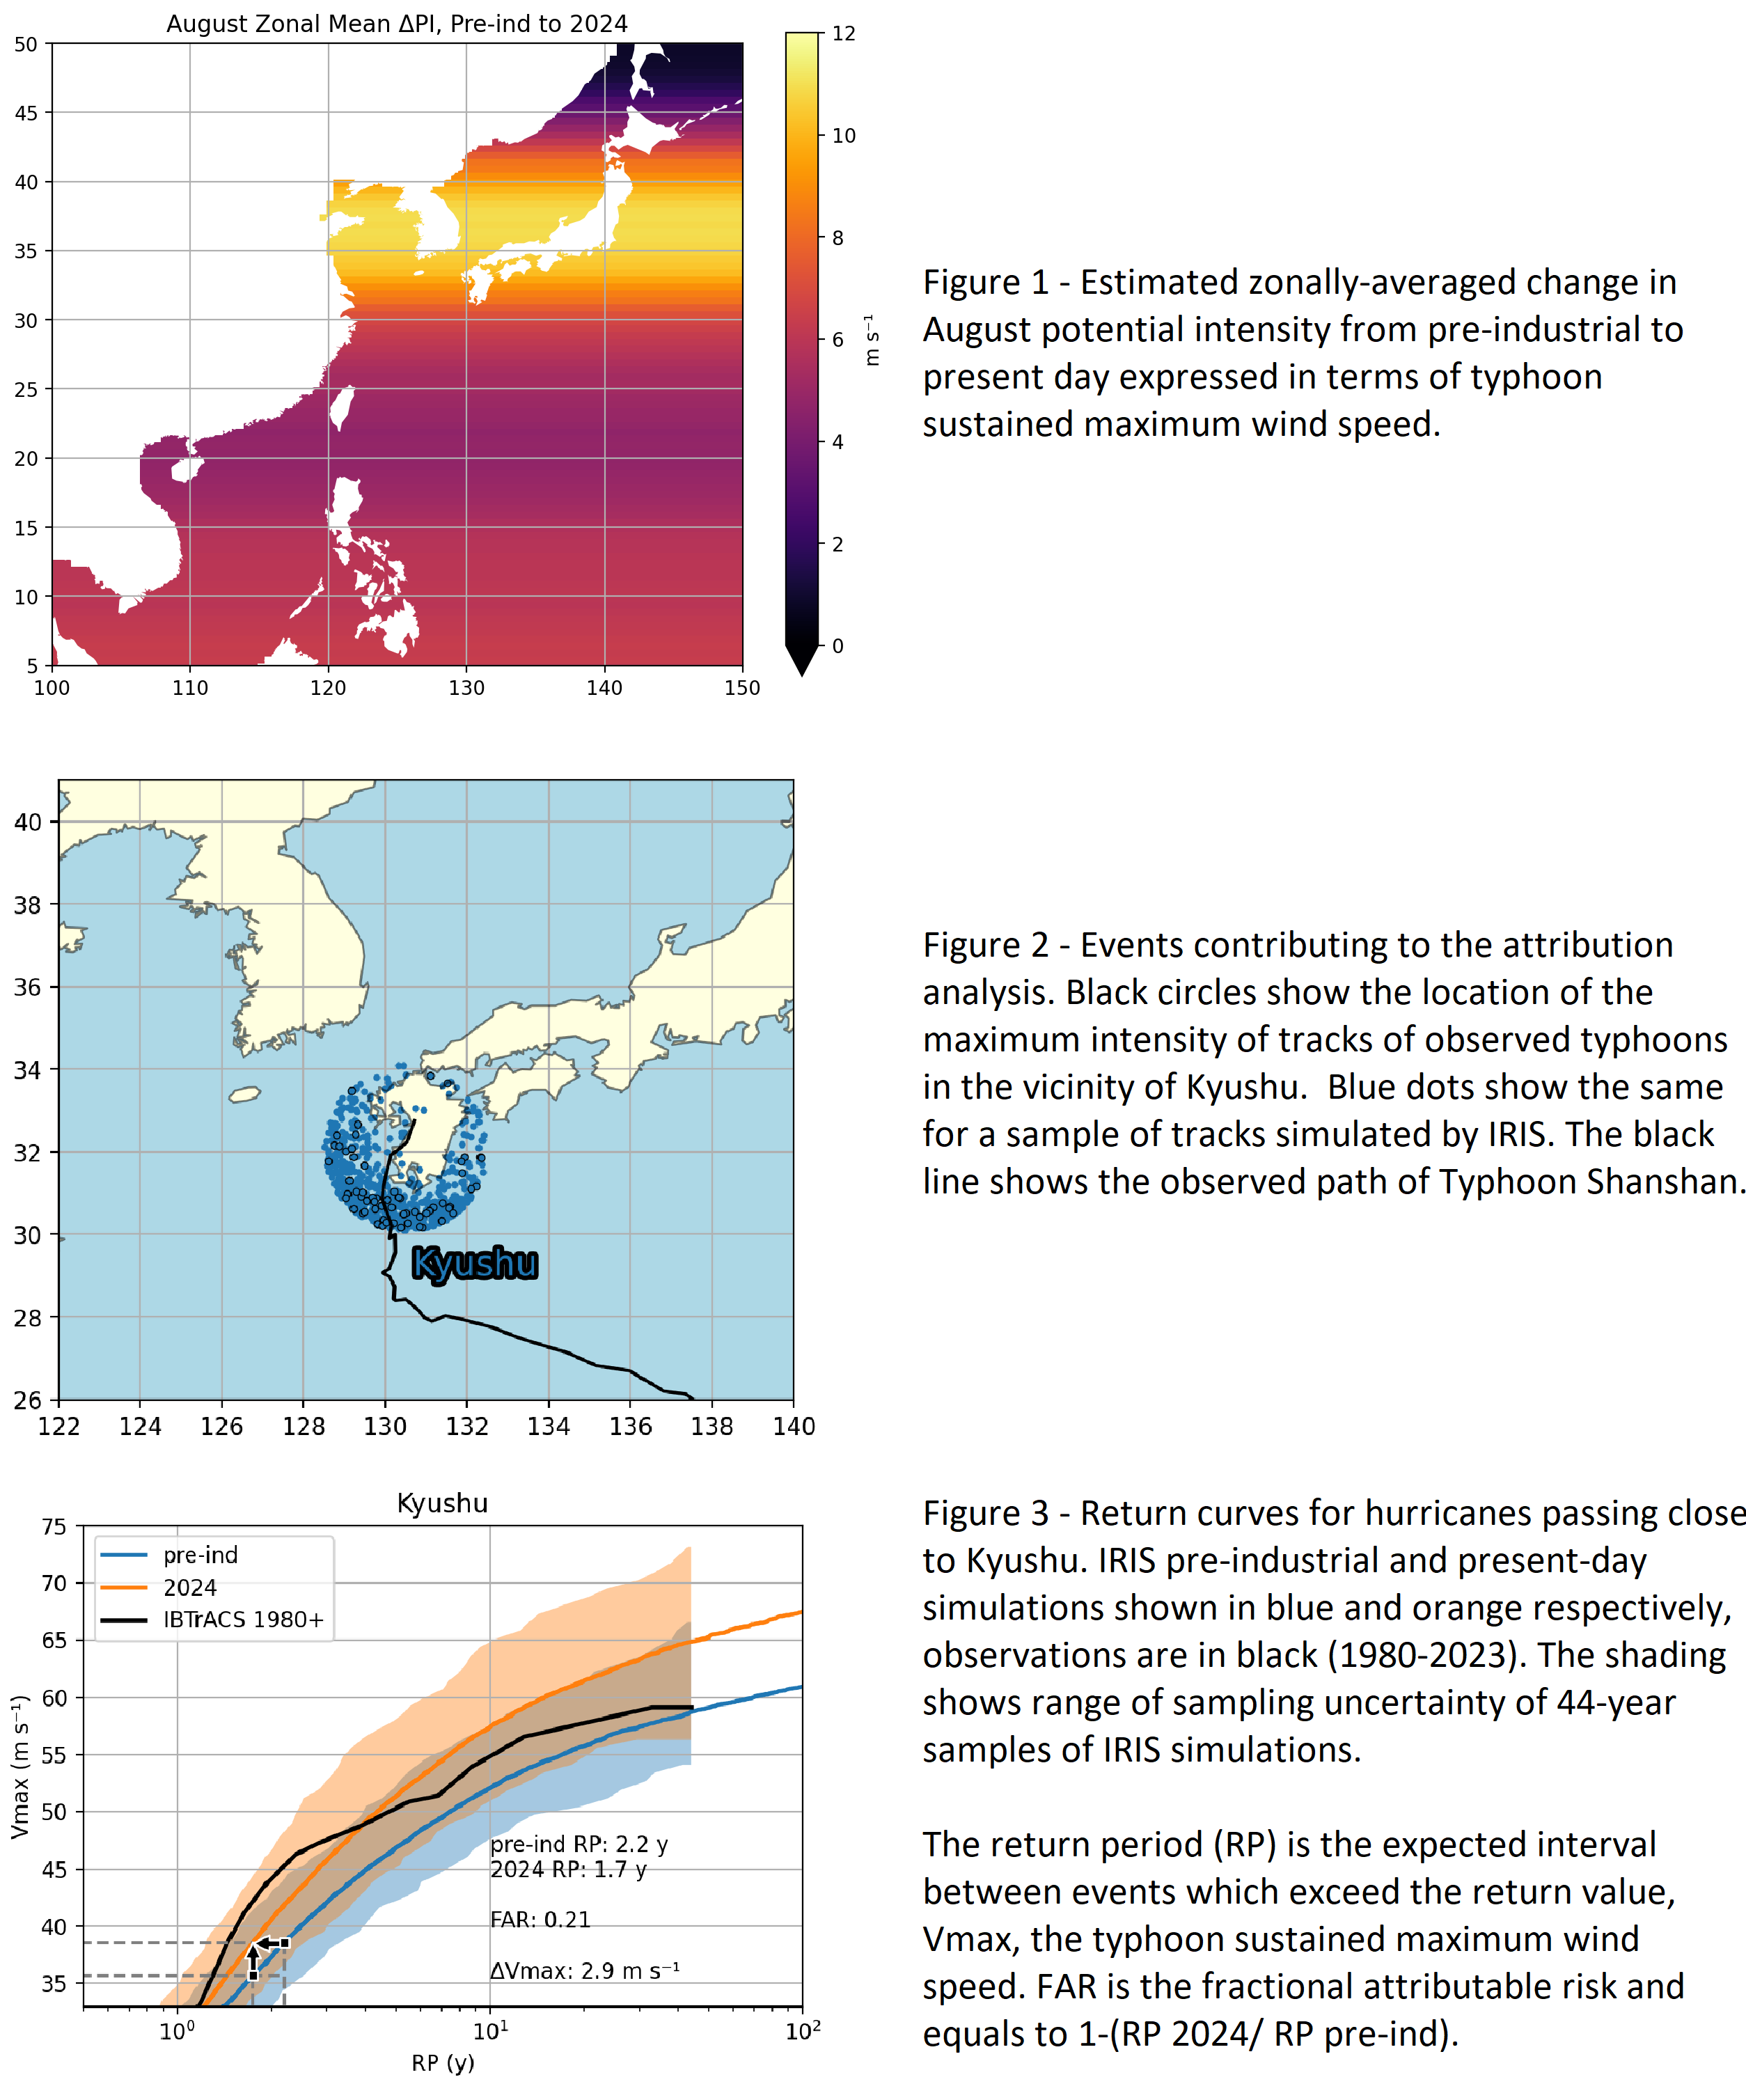
Using an innovative attribution method, climate scientists quantified the influence of climate change on Typhoon Shanshan's powerful winds that affected Japan’s southern island, Kyushu. The Imperial College Storm Model (IRIS) analysed synthetic storm tracks to determine what the intensity and likelihood of typhoons like Shanshan would be without 1.3°C cooler world to understand changes due to human-caused climate change.
Using IRIS, thousands of typhoons close to Kyushu were simulated (Figure 2), allowing the scientists to calculate a range of possible intensities in both a pre-industrial colder world or our current climate with 1.3°C of warming.
The study looked at potential intensity (Figure 1) and found that the maximum wind speeds of typhoons like Shanshan have become about 6.5 mph or 7.5% more intense due to climate change. This metric uses sea surface and air temperature, alongside air humidity data, to predict maximum typhoon wind speed.
The IRIS model also found that devastating typhoons like Shanshan have become 26% more likely due to climate change (Figure 3). In other words, with 1.3°C of warming, the expected frequency of conditions similar to Typhoon Shanshan has risen from around 4.5 times per decade to 5.7 times per decade.