


Carbon Footprint Annex 2022-23
Executive Summary
We are driven by a bold mission to achieve net zero by 2040. This ambitious goal encompasses all Scope 1 and 2 emissions, and we are committed to reducing Scope 3 emissions wherever possible. For the academic year 2022–23, we began reporting our carbon emissions using the new EAUC (Environmental Association for Universities and Colleges) Standardised Carbon Emissions Framework (SCEF) for the first time – wherever data availability permits.
The SCEF is based on the Greenhouse Gas Protocol and has been proposed as a new good practice voluntary standard for the Higher and Further Education sectors to report emissions from academic activities. It has broader coverage of Scope 3 than both the existing Higher Education Statistics Agency (HESA) reporting required for the Higher Education Sector and the Streamlined Energy and Carbon Reporting (SECR) reporting required for companies. The carbon emissions published in the Imperial College London Annual Financial Report used SECR and differ within Scope 1 and 2 from this report as SECR includes wider commercial activities, while SCEF focuses on only academic activities in those Scopes.
This report unveils a fascinating landscape of our carbon footprint. Using the EAUC SCEF, we have expanded our reporting to encompass previously unexplored areas, including staff homeworking and student travel, to provide a more holistic and detailed summary of our total carbon emissions. We have also revised our methodology for calculating emissions from spend data.
This report has been completed by the Imperial Zero Pollution (IZP): Our Campuses team with thanks to colleagues in Property and Major Projects, Campus Operations, and Procurement.
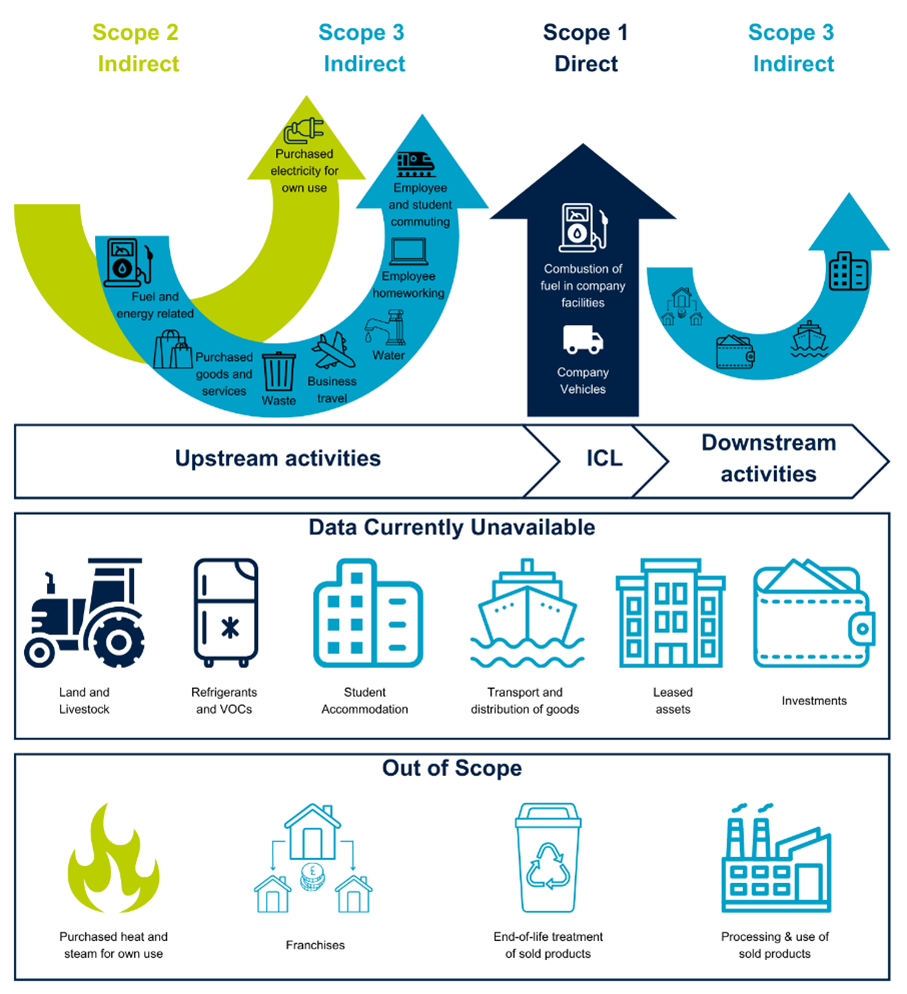 Figure 1: EAUC SCEF categories and their current application to Imperial College London’s carbon emissions report.
Our total carbon emissions for 2022–23 were Ca.240,000 tCO2e. This is a Ca.930 tCO2e increase compared to 2021–22 using the new methodology. This is largely due to an increase in business travel emissions as business travel increases back to pre-pandemic levels.
Figure 2: Imperial College London’s total carbon emissions for 2022–23.
.png)
Intro
Introduction
This report outlines the full methodology used to calculate Imperial College London’s 2022-23 carbon emissions. As shown below, the new methodology differs significantly from previous publications of Imperial's carbon management reports largely within Scope 3.
 Figure 3: A comparison of Imperial’s 2021-22 emissions using the old methodology as published in the Carbon Management Report and the new methodology.
As shown above, the new methodology has resulted in a decrease in our calculated emissions for 2021-22. Below we’ve highlighted the key areas of change which lie within Scope 3. The addition of four new categories added Ca.62,000 tCO2e to Imperial’s emissions. However, our refined methodology for analysing emissions from procurement resulted in a decrease of Ca.30,000 tCO2e; this methodology is outlined in Scope 3: Procurement and Supply Chain. We also saw a decrease of Ca.58,000 tCO2e within Scope 3: Fuel and Energy for two reasons: while refining our methodology, we found we had previously been double reporting some Scope 1 and 2 emissions within Scope 3 in this section, and for 2022-23 we switched from a spend-based analysis to a more accurate consumption-based analysis outlined in Scope 3: Fuel and Energy.
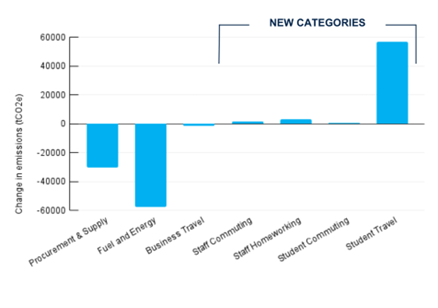 Figure 4: Change in emissions within key Scope 3 areas for 2021-22 using the old methodology as published in the Carbon Management Report and the new methodology published in this report.
To evaluate our changes in emissions over the last academic year in full, we compared the 2021-22 and 2022-23 emissions using the new methodology on both datasets. Overall, we saw a slight increase in emissions compared to the previous year.
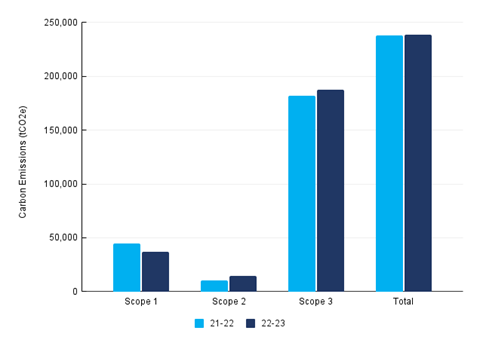 Figure 5: A comparison of Imperial College London’s 2021-22 and 2022-23 emissions per scope using the new methodology for both years.
Between 2021-22 and 2022-23, we saw a decrease in emissions for Scope 1: Natural Gas and Scope 3: Procurement and Supply, while there was an increase in emissions for Scope 2: Purchased Electricity and Scope 3: Business Travel. Further discussion on why these changes have occurred can be found in their respective sections.
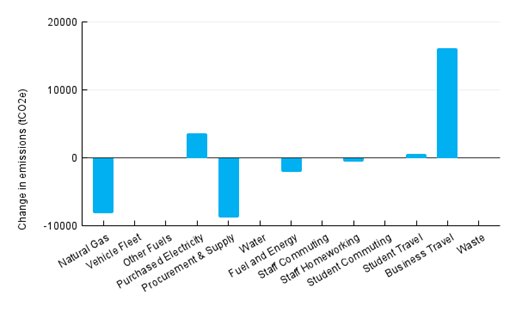 Figure 6: The change in carbon emissions for each category between 2021-22 and 2022-23 using the new methodology.
This report will discuss the methodology and results for each category within the SCEF used to calculate Imperial College London’s 2022-23 carbon emissions. Unless stated specifically, conversion factors (CF) have come from the UK Government GHG Conversion Factors for Company Reporting, compiled by the Department for Energy Security and Net Zero and the Department for Environment, Food, and Rural Affairs (DEFRA). All values have been rounded to two significant figures.
Overview: Total Emissions
The total emissions per category for 2022-23 and 2021-22. Categories that have been added or revised as part of the new methodology are highlighted in bold.
|
Scope |
Source |
2022-23 Emissions (tCO2e) |
Percentage of total emissions |
2021-22 Emissions (tCO2e) |
Percentage increase / decrease |
|
1 |
Natural Gas |
36,774.41 |
15.41% |
44,938.48 |
18% |
|
Vehicle Fleet |
16.95 |
0.0071% |
14.00 |
21% |
|
|
Other Fuels |
1.34 |
0.00056% |
0 |
NA |
|
|
2 |
Purchased Electricity |
14,192.46 |
5.95% |
10,573.76 |
34% |
|
3 |
Procurement and Supply Chain |
91,417.85 |
38.30% |
100,095.33 |
8.7% |
|
Water |
87.51 |
0.037% |
59.92 |
46% |
|
|
Fuel and Energy |
8,031.37 |
3.36% |
10,117.40 |
21% |
|
|
Waste |
198.86 |
0.083% |
193.76 |
2.6% |
|
|
Business travel |
25,468.44 |
10.67% |
9,342.60 |
170% |
|
|
Staff commuting |
1,904.00 |
0.80% |
1,884.39 |
1.0% |
|
|
Staff homeworking |
2,784.94 |
1.17% |
3,335.32 |
17% |
|
|
Student commuting |
584.40 |
0.24% |
578.31 |
1.1% |
|
|
Student travel |
57,244.80 |
23.98% |
56,648.27 |
1.1% |
|
|
Total |
245,000 |
|
240,000 |
2.2% |
|
List of Abbreviations
- BEIS – Department for Business, Energy and Industrial Strategy
- CHP – Combined heat and power unit
- CF – Conversion Factor(s)
- CO2e – Carbon Dioxide Equivalent
- DEFRA – Department for Environment, Food and Rural Affairs
- EAUC – Environmental Association for Universities and Colleges
- EMR – Estates Management Record
- FTE – Full-time equivalent
- GBP – Great British Pounds
- GHG – Greenhouse Gases
- HESA – Higher Education Statistics Agency
- HESCET – Higher Education Supply Chain Emissions Tool
- ICL – Imperial College London
- IZP – Imperial Zero Pollution
- REGO – Renewable Energy Guarantees of Origin
- SCEF – Standardised Carbon Emissions Framework
- tCO2e – Tonnes of Carbon Dioxide Equivalent
- VOC – Volatile Organic Compounds
- WTT – Well-to-tank
- WTW – Well-to-wheel
Scope 1 and 2 emissions
 Scope 1 emissions are our direct emissions as a result of sources we own and control. This is combustion of fuel in owned and controlled premises and emissions from owned land and livestock.
Scope 2 emissions are indirect emissions from the generation of grid-derived electricity and heat by utility providers. The University does not purchase heat or steam directly, so this is not included.
Scope 1 and 2
Scope 1: Natural Gas
Scope and Boundaries
The combustion of natural gas in on-site boilers and CHP in buildings that we operationally control. Buildings that are leased out or have a commercial arrangement with utilities included are not included in the scope. These reporting boundaries align to the Estates Management Record (EMR) from the Higher Education Statistics Agency (HESA).
Methodology
Advanced
ICL obtains natural gas for the CHP and gas boilers from the gas grid. Emissions are calculated by multiplying the consumption obtained from invoices by the 2023 CF for natural gas.
Data Sources
- Natural gas consumed in kWh.
- 2023 CF for ‘Natural Gas – Gross CV’ (kWh).
Results
The analysis found that Ca.37,000 tCO2e were emitted: Ca.19,000 from CHP, and Ca.17,000 from non-CHP.
This is a Ca.9,000 tCO2e decrease compared to 2021-22. Gas consumption has decreased as a result of works ongoing related to the de-steaming project at South Kensington, which resulted in the CHP units and boilers in the South Kensington Energy Centre being turned off from April 2023 leading to a reduction in gas use but an increase in purchased electricity.
Discussion
As noted in the Annual Sustainability Report, there is ongoing work to reach net zero in three key stages: removing the steam network; retrofitting our buildings to improve their fabric; improve energy efficiency and replace gas use in our energy centre with heat-pumps. A 15-year plan is being developed with the consultancy Arup.
Scope 1: Vehicle Fleet
Scope and Boundaries
In 2022-23, the ICL fleet consisted of 30 vehicles operated by 15 departments, with five long-term leases and six electric vehicles. Scope 1 emissions from the fleet are determined using fuel records supplied by the finance team.
Methodology
Advanced
Emissions have been calculated using fuel card records from the year 2022-23, which provides the fuel type and quantity purchases in litres. Litres of fuel is the multiplied by the relevant 2023 CF.
Data Sources
- Type of fuel consumed in litres.
- 2023 CF for 'Diesel – average biofuel blend’ (litres) and ‘Petrol - average biofuel blend’ (litres).
Results
The analysis found that Ca.17 tCO2e were emitted.
Discussion
In order to achieve Net Zero 2040, IZP: Our Campuses aim to review our vehicle fleet in 2023-24 and create an action plan which will consider the procurement policy for Imperial’s vehicles and infrastructure required to electrify the fleet.
Scope 1: Other Fuels
Scope and Boundaries
The combustion of diesel or oil in owned and controlled premises such as on-site boilers or generators. The scope covers temporary boilers in South Kensington and Harlington.
Methodology
Advanced
Emissions have been calculated using expense data of procured fuel, providing the fuel type and litres purchased.
Data Sources
- Type of fuel purchased in litres.
- 2023 CF for ‘Biodiesel HVO’ (litres).
Results
The analysis found that Ca.1.3 tCO2e were emitted.
Scope 1: Data Currently Unavailable
Refrigerants
Data is being collected from 1 August 2023 for all Property and Major Projects operated properties and is set to be reported at an Advanced level for 2023-24 for anything captured by the F-gas regulations.
Volatile Organic Compounds (VOCs)
We are investigating the possibilities within our procurement system to easily tag and track the purchase of VOCs for reporting in the Annual Sustainability Report.
Land and Livestock
Silwood Park Campus is 88ha of land, of which 73ha are classified as Parkland. In order to estimate our emissions from this area, further data on the species biodiversity and land type of the park would need to be gathered. Imperial does not own any livestock.
Scope 2: Purchased Electricity
Scope and Boundaries
Emissions as a result of generation of grid-derived electricity we consume.
Methodology
Advanced
Location-based approach: Metering data was obtained from our supplier in kWh and converted into tCO2e using the 2023 CF.
Market-based approach: Certificates were obtained from our supplier to reflect the emissions associated with the energy mix purchased.
Data Sources
- Electricity consumption in kWh.
- 2023 CF for ‘Electricity (UK)’ (kWh).
- REGO certification.
Results
The analysis found that Ca.14,000 tCO2e were emitted on a location basis, a Ca.4,000 tCO2e increase from 2021-22.
Our REGO certification certifies that the electricity purchased was from renewable sources between 1 October 2022 and 30 September 2025, and therefore emitted 0 tCO2e on a market basis.
Discussion
There has been an increase in electricity consumption compared to 2021-22 due to the ongoing works related to the de-steaming project mentioned in Scope 1: Natural Gas. In addition to the work previously mentioned, IZP: Our Campuses are launching sustainability initiatives such as Green Impact and LEAF in 2023-24 to promote energy saving and demand reduction behavioural change on campus. More about this can be found in the Annual Sustainability Report.
We purchase electricity under the REGO Scheme (renewable energy guarantee of origin). For August and September 2022 that was from Npower and from October 2022 onwards from Drax. Drax operate biomass plant alongside hydropower, wind, and photovoltaic (solar power). We recognise that there are carbon dioxide emissions associated with biomass but, to date, none of our REGO certificates are from biomass.
Scope 3 emissions
 Scope 3 covers the widest range of emissions and accounts for 79% of Imperial College London’s total carbon emissions – which is similar to the footprints of many other organisations. It includes all indirect emissions from up and down the value chain, ranging from water and waste to staff commuting and business travel.
Emission sources franchises and sold products are not applicable to Imperial and therefore have not been included in the report.
Scope 3
Procurement and Supply Chain
Scope and Boundaries
Procurement and Supply Chain includes all upstream emissions as a result of goods and services purchased. This has previously been based on the HESCET (Higher Education Supply Chain Emissions Tool), a scope 3 emissions tool for the education sector developed by HEPA (Higher Education Procurement Association). HESCET typically includes emissions for business travel, utilities, and waste; we have calculated these separately using a consumption-based methodology as opposed to a spend-based methodology, and they are reported in their respective sections within Scope 3.
Methodology
Basic
The standard HESCET approach maps Imperial’s spend codes to the Procurement Higher Education (ProcHE) coding, which is then mapped to 311 standard categories set by Defra with known spend-based emissions factor. These 311 categories can be grouped in 12 high-level sectors. For this report, the HESCET mapping and categorisation was revised to ensure an accurate reporting of Scope 3 emissions. A full methodology can be found in Appendix 2, but the key changes implemented were:
- 21 new categories were created as two new high-level sectors ‘Laboratory and research’ and ‘Professional and bought-in services’ with new CF.
- An alternative calculation approach was used and integrated into the HESCET for categories such as water; electricity; and gas.
- Emissions were re-grouped according to the existing Imperial’s organisation structure to ease data analysis, future monitoring, and decision making, referred to as ‘Emissions per actionable group’.
Data Sources
- Total expenditure in GBP.
- HESCET tool and associated CF.
- Revised CF from the UK Government GHG Emissions Conversion Factors; EPA GHG Emissions Factors; and EXIOBASE.
Results
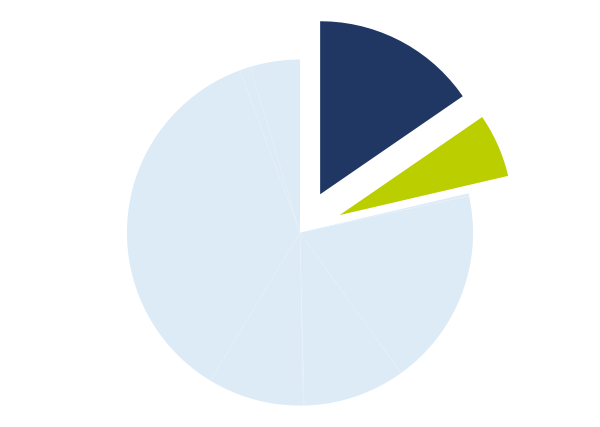
The analysis found that Ca.91,000 tCO2e were emitted, a decrease compared to 2021-22 despite total expenditure being similar. By actionable group, our highest priority areas for review sit within ICT; travel; and laboratory and research, as shown by the graph below.
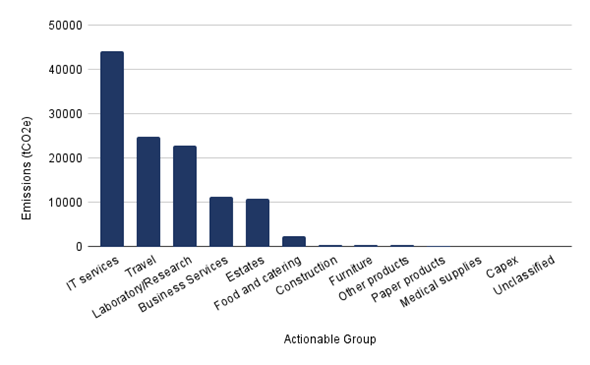 Figure 7: 2022-23 procurement and supply chain emissions shown by actionable group.
A further analysis of the 2021-22 and 2022-23 procurement data found that the changes in emissions was due to both changes in spending and refreshed CF from HESCET. In 2022-23, Imperial’s spend on construction, capex, and travel significantly increased compared to 2021-2, while expenditure on medical supplies, paper products, and furniture decreased. This is expected to fluctuate within certain categories where spending is dependent on when major purchases are made, or contracts let.
Discussion
While it is the standard approach in the sector, using a spend-based methodology comes with several limitations. The coding of expense data to the correct categories has risk of human error, and the CF are generic to each category, failing to recognise nuances between e.g. first class and economy air travel. The HESCET CF are also updated every few years as opposed to annually like the UK Government GHG Emissions Conversion Factors. To proceed to Intermediate or Advanced reporting as set out in the EAUC SCEF, Imperial would need to work directly with suppliers to obtain product and service-based emissions as opposed to spend-based, which is unrealistic to achieve in the short-term as this would be labour-intensive and many suppliers do not have this data available.
In 2023-24, the Procurement team at Imperial aim to develop a Sustainable Procurement Policy and Action Plan with support from the consultancy Action Sustainability. This will improve supplier engagement to reduce emissions, as well as ensuring sustainability is a priority in all future procurement decisions.
Water
Scope and Boundaries
This includes the upstream emissions associated with all purchased water Imperial consumed. Buildings that are leased out or have a commercial arrangement with utilities included are not included in the scope. These reporting boundaries align to the EMR guidelines from HESA.
Methodology
Intermediate
Water data was obtained from the supplier in m3 and multiplied by the 2023 CF.
Data Sources
- Water consumption in m3.
- 2023 CF for ‘Water supply’ (cubic metres).
Results
The analysis found that Ca.88 tCO2e were emitted.
Discussion
To proceed to Advanced reporting per the EAUC SCEF, local or regional CF should be used, which currently are not published by the UK Government. Water resource and demand varies across the UK, with the Southeast region having the highest projected water supply demand deficit [link], resulting in varied emissions. Water UK, the trade association for the water industry, published in their 2021-22 Annual Report that Thames water had a greenhouse gas intensity of Ca.150 kgCO2e per Ml for water supply and Ca.180 kgCO2e per Ml for water treatment [link].
Fuel and Energy
Scope and Boundaries
This includes the upstream emissions as a result of fuel and energy consumption within Scope 1 and 2, such as transmission and transportation of fuel to the point of use.
Methodology
Advanced
Electricity and gas data obtained for Scope 1 and 2 were converted into tCO2e using 2023 CF. For electricity, transmission, and distribution (T&D) CF are used which consider the emissions associated with grid losses. For fuels, which includes natural gas, well-to-tank (WTT) CF are used which calculates the emissions associated with extracting, refining, and transporting the raw fuel sources to our site.
Data Sources
- Gas consumption data in kWh obtained from supplier invoices.
- Electricity consumption data in kWh obtained from supplier invoices.
- 2023 CF for ‘Transmission and Distribution – UK Electricity’ (kWh) and WTT ‘Natural Gas – Gross CV’ (kWh).
Results
The analysis found that Ca.8,000 tCO2e were emitted: Ca.1,400 tCO2e from electricity and Ca.6,700 tCO2e from gas.
Waste Disposal and Treatment
Scope and Boundaries
The upstream emissions from disposing and treating waste, recycling, and wastewater.
Methodology
Waste and Recycling - Advanced
Imperial obtains tonnage data from our supplier which includes tonnage by material and treatment. Emissions are then calculated using CF which are both material and treatment specific.
Wastewater - Basic
Volume of water supplied was converted into tCO2e by assuming 95% of total water supplied was disposed of and treated and applying the national 2023 CF.
Data Sources
- Waste data in tonnes, split by material and treatment.
- 2023 CF from WRAP and the UK Government Environment Agency.
- Water consumption data in m3.
- 2023 CF for 'Water treatment’ (cubic metres).
Results
The analysis found that Ca.100 tCO2e were emitted from waste and recycling. In addition, Ca.94 tCO2e were emitted as a result of wastewater disposal and treatment, emitting a total of Ca.200 tCO2e.
Discussion
While our emissions from waste and recycling have increased compared to 2021-22, we have been moving up the waste hierarchy steadily since 2019-20. In 2022-23, 45% of our total waste was recycled, an increase from 2021-22.
To proceed to Intermediate reporting per the EAUC SCEF, local or regional CF would need to be used for wastewater as discussed in Scope 3: Water.
Business Travel
Scope and Boundaries
The upstream emissions as a result of all travel undertaken by staff, students, and guests for business purposes.
Methodology
Air Travel and Rail Travel - Advanced
The majority of ICL’s air travel purchases are through our external supplier Egencia, who calculate emissions considering mileage, fuel consumptions, and class of travel. For the remaining emissions which are expensed, we only have expense data. Instead of using conversion factors provided by HESCET, we calculated a conversion factor based off the total spend and total tCO2e emissions from Egencia to project total tCO2e from all air travel expenditure.
Taxi and Coaches - Basic
This includes taxis, coaches and vehicles with a hired driver. Expenditure in GBP was converted to tCO2e using the spend-based CF provided by the HESCET tool.
Hotels and Subsistence - Basic
This includes all meals expensed for business trips within our travel and expenses policies, as well as hotel stays. Expenditure in GBP was converted to tCO2e using the spend-based CF provided by the HESCET tool.
Car Hire - Basic
This includes all costs associated with car hire and leases. Expenditure in GBP was converted to tCO2e using the spend-based CF provided by the HESCET tool.
Grey Fleet - Basic
Grey fleet refers to all costs from vehicles owned and driven by employees for business purposes. It is recorded by mileage reclaimed. Expenditure in GBP was converted to tCO2e using the spend-based CF provided by the HESCET tool.
Data Sources
- Expenditure in GBP for business travel expenses.
- Spend-based CF from HESCET.
- Expenditure in GBP and emissions in tCO2e from Egencia.
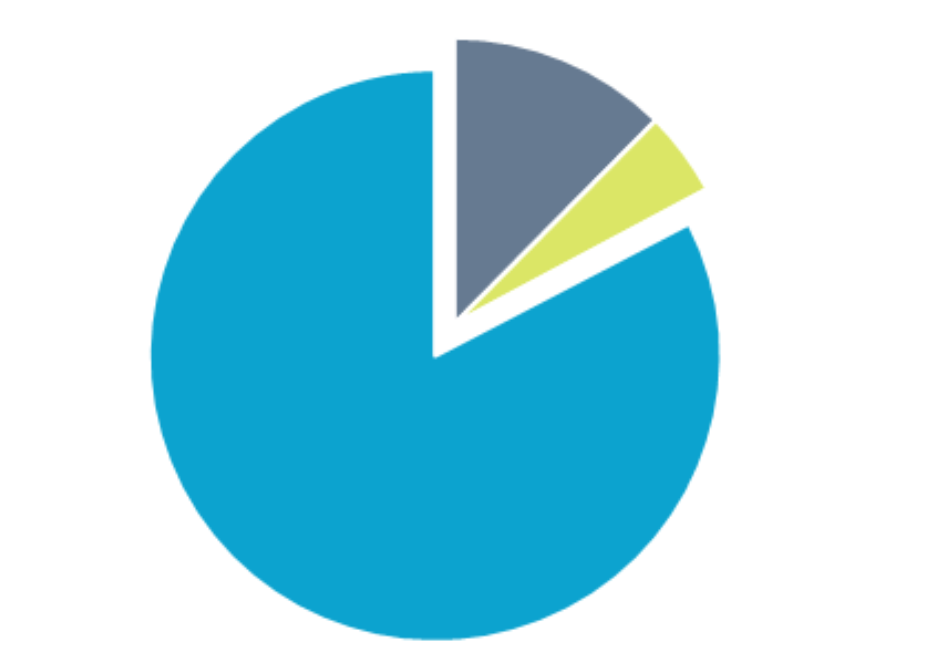
Results
The analysis found a total of Ca.25,000 tCO2e were emitted.
 Figure 8: 2022-23 business travel emissions per mode of travel.
This is an increase of Ca.16,000 tCO2e or 170% compared to 2021-22. It is important to note that business travel dipped significantly from Spring 2020 due to the pandemic and has been steadily increasing from Autumn 2021 back to pre-pandemic levels. For 2022-23, there have also been significant revisions to the CFs for business travel. The UK Government increased air travel CF by up to 35% due to reduced load factors as an ongoing consequence of the pandemic [link]. The newly released HESCET tool saw significant increases to CF for grey fleet; air travel; and rail travel, while CF for taxis, coaches, and leased vehicles decreased by up to 74%.
Discussion
To proceed to Intermediate or Advanced reporting per the EAUC SCEF, all categories of business travel should be calculated using a process-based emissions reporting using actual mileage and well-to-wheel (WTW) CF. Furthermore, an analysis of air and rail travel expenses that are not processed through Egencia should be carried out regularly to improve the accuracy of our estimation.
In 2022-23, the Travel Working Group was established to initially focus on developing a policy for sustainable business travel. Looking forward to 2023-24, the plan is to finalise and implement the policy of taking climate conscious travel decisions: using virtual collaboration and rail wherever possible; focusing on quality not quantity of travel; and only using higher classes of flights where exceptional reasons apply.
Staff Commuting
Scope and Boundaries
The upstream emissions from employees travelling to and from work.
Methodology
Advanced
Results from a 2014-15 staff commuting survey were used which supplied mode of transport and distance travelled. 623 individuals answer the survey, or 7.5% of the staff population at the time. To this, we applied our 2022-23 On Site full-time equivalent (FTE) for staff and 2023 WTW CF.
Assumptions:
- Distances provided in the survey were for a round-trip.
- Survey results were applicable across the whole staff population in 2022-23.
- A standard 44-week work year, considering 3 weeks of university closure and 5 weeks of annual leave.
Data Sources
- 2014-15 staff survey results.
- 2022-23 staff statistics.
- 2023 CF for ‘WTW – Passenger Vehicles and Travel by Land’.
Results
The analysis found that Ca.1900 tCO2e were emitted.
Discussion
To improve our analysis, a fresh staff commuting survey would be needed to assess how commuting may have changed over the last ten years and following the pandemic. Looking toward 2024, the Sustainable Travel Working Group is looking to develop an Active Travel Action Plan which will hopefully increase the number of employees and students choosing low or no emitting modes of commuting.
Staff Homeworking
Scope and Boundaries
The upstream emissions from employees working from home during their contractual hours.
Methodology
Intermediate
Homeworking emissions were calculated using the basic methodology from the Homeworking Emissions Whitepaper produced by ecoact in partnership with Lloyds Banking Group and NatWest Group. This converts FTE into kWh, considering office equipment and heating energy. 2023 CF were then used to calculate tCO2e.
Homeworking FTE values were provided by HR using the 2022-23 staff survey results and omitting staff from the Student Union.
Data Sources
- 2022-23 staff statistics.
- 2023 CF for ‘UK Electricity’ (kWh).
Results
The analysis found that Ca.2800 tCO2e were emitted.
Discussion
The data required to proceed to Advanced reporting per the EAUC SCEF are noted below.
- Internal records for standard issued equipment and typical power consumption when in use.
- Confirmation from staff that typical workstation, lighting, and heating is used when working from home.
- Staff survey to confirm proportion of employees purchasing green energy at home.
- Information from staff on typical home energy use and shared occupancies.
Most of these are unfortunately unrealistic to achieve in a short-term, and when we consider materiality, Staff Homeworking accounts for just 1.2% of Imperial’s total emissions. For now, we are focusing our efforts to improve our methodologies on the more material categories. Imperial is however keen to improve our understanding of power consumption and emissions of standard ICT equipment and software, with projects in 2023-24 beginning to scope this area.
Student Commuting
Scope and Boundaries
The upstream emissions from students commuting to and from the university as required by the university.
Methodology
Intermediate
Results from the 2018-19 Student Experience Survey were used, which provides mode of transport; number of days travelled on to campus per week; and length of journey in minutes. From this, the distance of journeys could be estimated. 4876 students (3799 undergraduate and 1077 postgraduate) answered these questions, or 25% of the student population at the time. The survey was not open for final year undergraduate students who instead participate in the National Student Survey.
Several assumptions were made for the calculations:
- Undergraduates have a 31-week year with the summer, Christmas, and Easter holidays excluded.
- Taught postgraduates have a 44-week year with the Christmas and easter holidays excluded.
- Research postgraduates have a 47-week year with 5-weeks of annual leave.
- Student commuting habits have not significantly changed since 2018-19 and post-pandemic.
Data Sources
- 2018-19 Student Experience Survey results.
- 2022-23 student statistics.
- 2023 CF for ‘WTW – Passenger Vehicles and Travel by Land’.
Results
The analysis found that Ca.580 tCO2e were emitted.
This is a third of staff commuting emissions, despite the student population at Imperial being three times larger than the staff population. This is largely because students have a significantly smaller commuting average commuting distance compared to staff and are also more likely to use modes of transport such as cycling and walking which do not result in any carbon emissions.
Discussion
The Student Experience Survey runs annually, and we hope to continue implementing questions relating to student commuting. To improve to Advanced level of reporting per the EAUC SCEF, the questionnaire should also consider multiple legs of commuting journeys.
Student Travel
Scope and Boundaries
The upstream emissions from students travelling between university and their family home annually.
Methodology
Intermediate
Data was taken from a 2022-23 departmental student survey which collected the number of trips people took home annually; the mode(s) of transport; and country of their destination. The survey received 122 responses, split between 75 undergraduates and 47 postgraduates. We focused solely on air and rail travel to calculate the emissions and placed an upper limit of five roundtrips annually.
Domestic Students
As destinations were collected as countries as opposed to postcodes, we assumed an average distance to the population centre of mass of the UK, which is Snarestone, Leicestershire. The frequency of trips was based on the survey results and extrapolated to the total 2022-23 domestic student population.
EU and Overseas Students
The air-line distance was mapped to the centre of each country from London as opposed to flight or rail routes. The distances were then used to calculate an average short-haul and average long-haul travel distance and applied to the 2022-23 EU and Overseas student population respectively. Mode and frequency of trips was based on the survey results.
Data Sources
- 2022-23 departmental student travel survey.
- 2022-23 student statistics.
- 2023 CF for ‘WTT - Flights’ and ‘WTT - Rail’ (km).
Results
The analysis found that Ca.1300 tCO2e were emitted from domestic student travel and Ca.56,000 tCO2e from EU and Overseas student travel, contributing Ca.57,000 tCO2e overall.
Discussion
To improve our analysis, more students would need to be surveyed to provide more reliable data. To improve to the Advanced level of reporting per the EAUC SCEF, the survey would also need to consider multiple legs of journeys and class of travel, especially for air travel.
Student travel to home is largely outside of Imperial’s control; without changing our student or term model, we can expect our student population to travel home throughout the year. The EAUC SCEF recommends taking responsibility for a minimum of two return trips per year per student – in this analysis, we have assumed responsibility for up to five return trips per year per student.
Data Currently Unavailable
Capital Expenditure
Upstream emissions for capital expenditure have been included within Procurement and Supply Chain using spend-based CF, which is a Basic reporting level per the EAUC SCEF. However, for this report we have been unable to separate these emissions from the larger procurement emissions. To proceed to an Intermediate or Advanced reporting level per the EAUC SCEF, emissions would need to be estimated using either an extended input-output model to spend or by performing a whole-life carbon assessment for each project. Currently, payment for capital expenditure and therefore its emissions as well are reported at the point of payment as opposed to the point of construction.
Student Accommodation
Currently, the EAUC SCEF provides guidance on calculating downstream emissions from student accommodation that are on-site but owned or managed by an external organisation to a basic reporting level. ICL does have agreements with on-site external student accommodation providers such as GradPad.
Leased Buildings and Vehicles – Upstream
The guidance on calculating emissions from buildings where the institution is the lessee is currently limited and provided on a case-by-case basis. ICL is the lessee of several spaces in buildings, predominantly from the NHS Trust on the Hammersmith and Charing Cross campuses.
Leased Buildings and Vehicles – Downstream
The guidance on calculating emissions from buildings where the institution is the lessor is currently limited and provided on a case-by-case basis.
Imperial leases out several spaces in its buildings to external parties who, per the EMR guidelines provided by HESA, are excluded from reporting in Scope 1 and 2.
Investments
Guidance on calculating downstream emissions from investments is currently limited and provided on a case-by-case basis. Calculating emissions for investments will be investigated further once more guidance is available.